- Borrowing costs have doubled. SBA 7(a) loan interest rates jumped from 5.5% in 2021 to 11.1% in 2024, though 2025 shows early signs of relief at 10.3%.
- Business formation is booming, but it is changing. 5.24 million applications were filed in 2024, yet "high-propensity" applications (businesses likely to hire) dropped from 37.8% to 30.3%.
- Regional shifts are accelarting. Florida now leads business formation (634,610 applications), Montana is the fastest-growing state (+13.8%), and the South receives the largest SBA loans ($623K average).
How much funding do small businesses actually receive? Which industries get the most SBA loans? And what does it really cost to create a new job?
We didn't just compile statistics from press releases. We downloaded and analyzed 357,866 SBA 7(a) loans, 5.2 million business formation applications, and $175 billion in federal contracts to produce insights you won't find anywhere else.
Key findings
- SBA 7(a) interest rates doubled from 5.5% (2021) to 11.1% (2024)
- Hotels require $217,665 in SBA loans per job created; home health care needs just $13,618
- Full-service restaurants receive the most SBA loans of any industry (16,469)
- Florida leads business formation with 634,610 applications in 2024
- Small businesses won $175.7 billion in federal contracts in FY2025
- Montana had the fastest-growing business formation rate (+13.8% YoY)
Where we got our data
The small business statistics below come from our own analysis of three primary government datasets that we downloaded and analyzed directly:
SBA 7(a) loan database (FOIA release)
- Source: data.sba.gov
- Records analyzed: 357,866 individual loans
- Time period: Fiscal years 2020-2025 (through December 2025)
- Variables analyzed: Loan amounts, NAICS industry codes, business age, franchise status, jobs supported, loan status, interest rates, lender information, geographic location
Census Bureau business formation statistics
- Source: census.gov/econ/bfs
- Records analyzed: Weekly business application data by state
- Time period: 2006-2025
- Variables analyzed: Total applications, high-propensity business applications, state-by-state trends
USASpending.gov federal contract data
- Source: USASpending.gov API
- Scope: All federal contracts to small business recipients
- Time period: Fiscal years 2021-2025
- Variables analyzed: Contract amounts by agency, industry (NAICS), and state
All statistics marked with an asterisk (*) are original findings from our analysis of raw data.
SBA 7(a) loan volume and distribution
We analyzed every loan in the SBA's FOIA database to compile the most detailed small business lending statistics available. Here's what we found.
1. The SBA approved 357,866 loans totaling $185.9 billion from FY2020 through December 2025
We analyzed every individual 7(a) loan in the SBA's public database to calculate these totals. This represents the most comprehensive look at SBA lending activity over this period.*
2. FY2025 was a record year for SBA lending, with $37.3 billion approved through Q1
At this rate, full-year lending would exceed $45 billion — surpassing any previous fiscal year on record.*
3. Loan volume jumped 62% from FY2020 to FY2021 during the pandemic recovery
SBA lending surged from $22.5 billion to $36.5 billion in a single year as businesses sought capital to rebuild.*
4. The median SBA loan is $190,000
While average loans get reported at $478,000, the median tells a different story about what typical small businesses actually receive. Half of all SBA borrowers receive $190,000 or less.*
5. 40.9% of SBA loans are under $150,000
Nearly half of all SBA loans (146,442 loans) fall in the smaller loan categories, showing that SBA lending isn't just for large deals.*

SBA 7(a) geographic distribution
6. California leads all states with 41,504 SBA loans worth $26.2 billion
That's 11.6% of all loans by count but 14% by dollar volume, indicating larger average loans in the state.*
7. Texas ranks second with 27,103 loans totaling $19.8 billion
Texas businesses receive an average of $729,000 per loan, higher than the national average.*
8. Los Angeles County alone received 12,131 SBA loans
That's more than 40 entire states received individually — highlighting the extreme concentration of SBA lending in major metro areas.*
9. The South region receives 31% of all SBA 7(a) loans
The South leads with 111,028 loans ($69.2 billion), followed by the West (91,216 loans, $53.8 billion).*
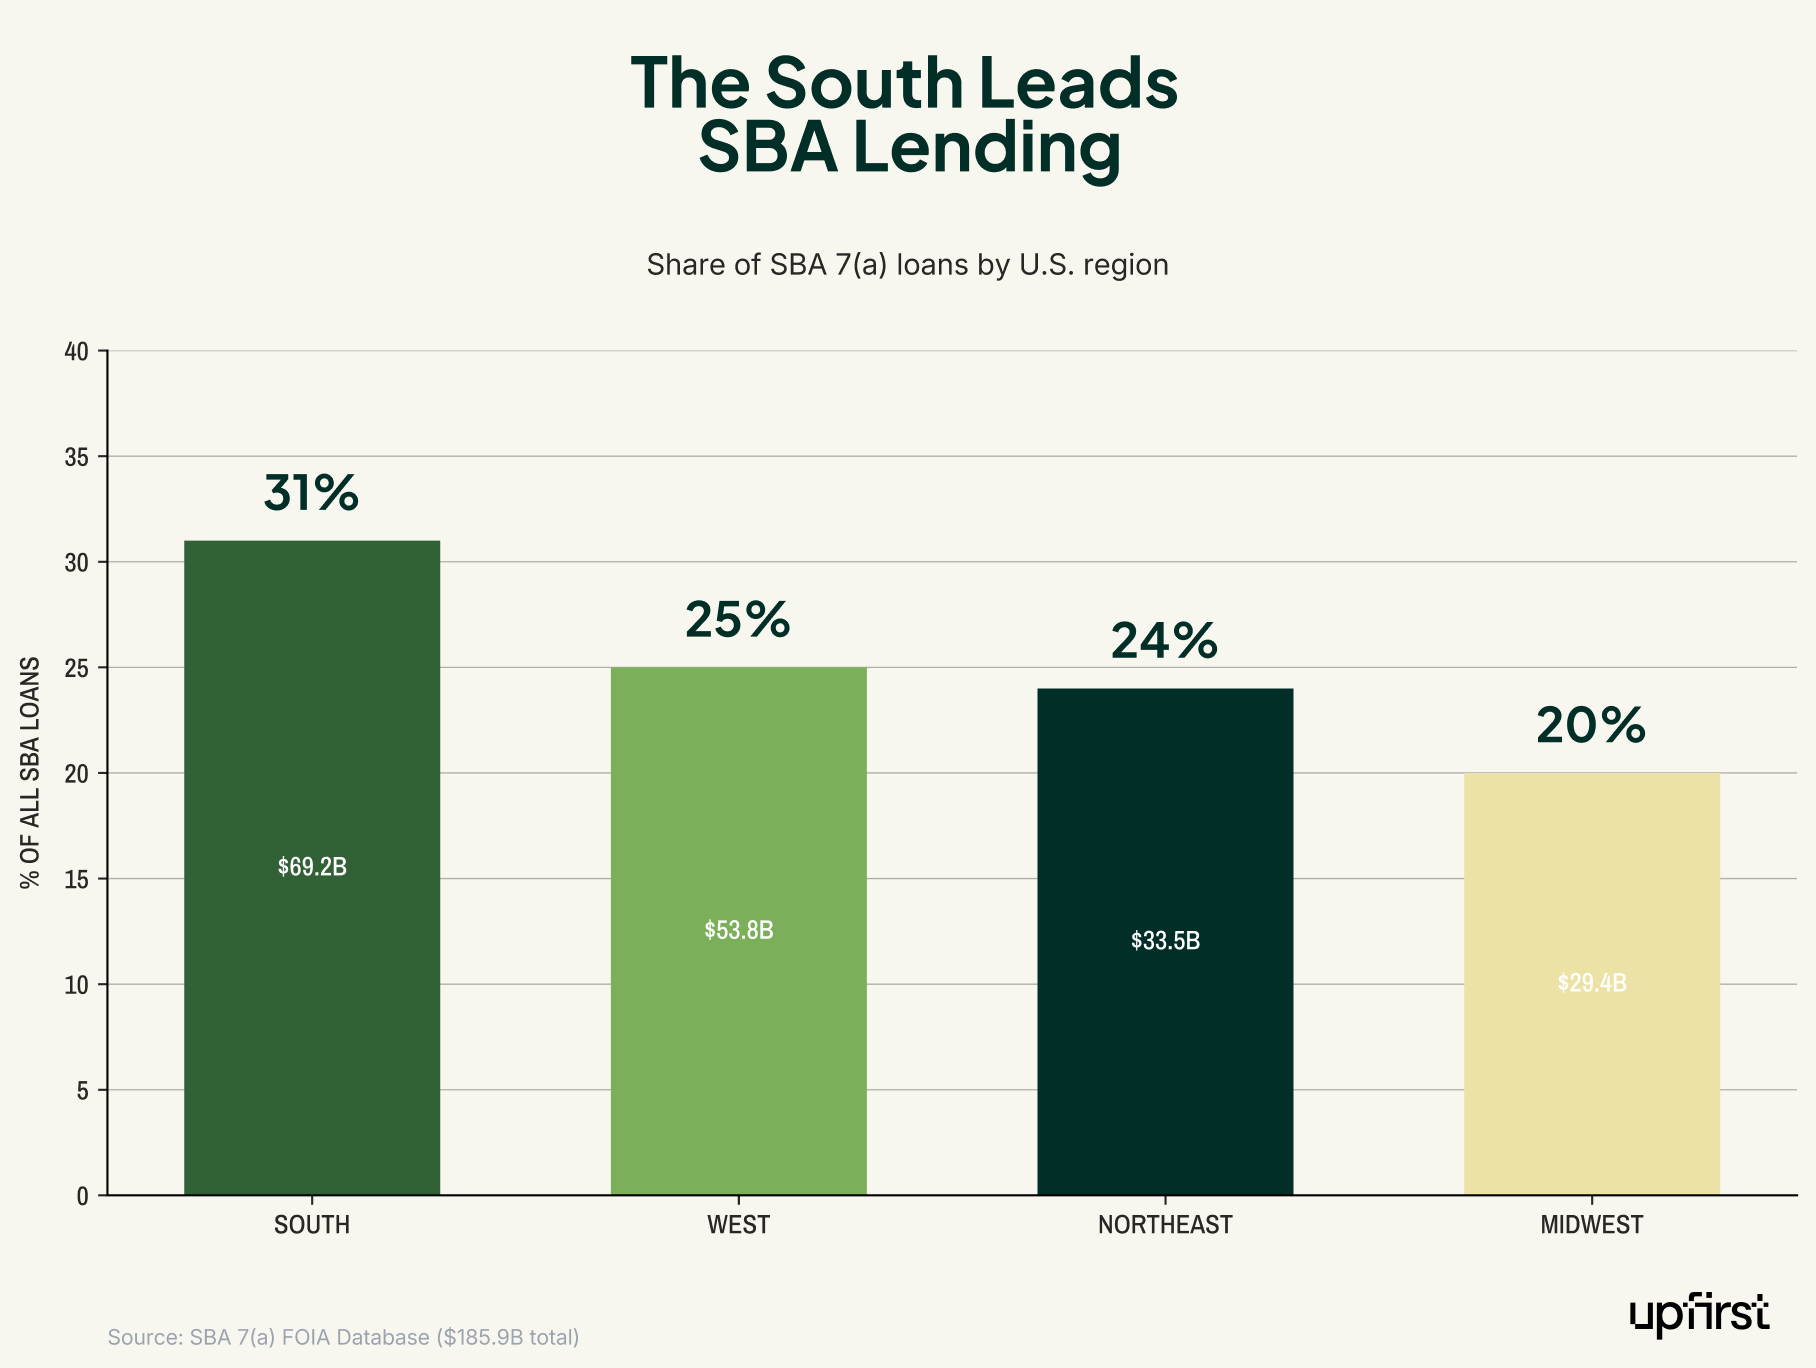
10. Southern businesses receive larger average loans ($623,000) than any other region
Northeast businesses average just $385,000 per loan — a 38% gap compared to the South.*
SBA 7(a) industry analysis
11. Full-service restaurants receive the most SBA loans of any industry: 16,469 loans totaling $8.6 billion
Limited-service restaurants rank second with 12,020 loans. The restaurant industry dominates SBA lending by volume.*

12. Hotels have the highest average loan size at $2.49 million
This reflects the capital-intensive nature of hospitality — building or acquiring a hotel requires significantly more funding than most other small business ventures.*
13. Residential remodeling is the third-most common industry for SBA loans (7,351 loans)
These contractors average just $184,000 per loan, one of the lowest averages among top industries.*
14. Child day care centers receive 5,081 SBA loans with an unusually high average of $807,000
This reflects the significant capital required for licensing and facilities — day care centers need purpose-built spaces that meet strict regulatory standards.*
15. The trucking industry receives 12,403 combined SBA loans
Long-distance trucking (6,764) and local freight (5,639) are both top-10 industries for SBA lending by loan count.*
SBA 7(a) interest rates over time
16. SBA loan interest rates doubled from 5.5% in 2021 to 11.1% in 2024
This reflects Federal Reserve rate increases during the inflation period. Borrowers in 2024 paid twice as much in interest as those who locked in rates three years earlier.*

17. Rates have begun moderating in 2025, averaging 10.3%
This represents the first meaningful decline since 2021, suggesting some relief ahead for small business borrowers.*
18. FY2020 loans averaged 6.5% interest despite pandemic uncertainty
The low-rate environment benefited businesses that could still access credit, with rates averaging 6.5% even as economic conditions were at their most uncertain.*
SBA 7(a) franchise vs. independent businesses
19. 11.8% of SBA loans go to franchise businesses
Franchises received 42,160 loans compared to 315,706 for independent businesses.*
20. Franchise businesses receive 61% larger loans on average ($779,000 vs. $485,000)
Franchises' established business models likely contribute to higher approval amounts — lenders see lower risk in proven concepts.*

21. The UPS Store is the top franchise for SBA loans with 943 loans averaging $366,000
The franchise model's turnkey approach attracts consistent SBA lending, making UPS Store one of the most-financed franchises in the country.*
22. Quality Inn is the most expensive franchise to finance at $2.79 million average loan
Hotel franchises dominate the high end of SBA lending, with Quality Inn averaging nearly $2.8 million per loan.*
23. Naturals2Go vending franchise has the smallest average loan at $129,000
Low-cost franchise models enable smaller SBA loans — Naturals2Go borrowers need less than $130,000 on average to get started.*
SBA 7(a) startup vs. established businesses
24. 55.6% of SBA loans go to established businesses (2+ years old)
These 198,975 loans average $435,000, reflecting the ongoing capital needs of existing businesses.*

25. 16.2% of SBA loans fund brand-new startups (business not yet open)
These 57,928 startup loans average $525,000 — higher than loans to existing businesses, suggesting new ventures often require more upfront capital.*
26. 10.3% of SBA loans fund business acquisitions, averaging $1.12 million
Buying an existing business requires significantly more capital than starting fresh, with acquisition loans averaging over $1.1 million.*
27. Full-service restaurants lead startup SBA lending with 4,168 loans
Fitness centers (3,631) and coffee shops (2,454) round out the top startup categories — food and fitness are where new entrepreneurs bet most.*
SBA 7(a) job creation efficiency
28. SBA 7(a) loans supported 3.77 million jobs from FY2020-2025
Based on borrower-reported job creation and retention data, SBA-backed businesses supported nearly 4 million jobs over this period.*
29. The average SBA loan supports 11.9 jobs
This varies dramatically by industry — some sectors create far more jobs per dollar than others.*
30. Hotels require $217,665 in SBA loans per job created or retained
This makes hospitality the most capital-intensive industry for job creation through SBA lending.*

31. Home health care is the most efficient at $13,618 per job
Healthcare services leverage SBA funds to maximum employment effect — creating or retaining jobs at a fraction of what other industries require.*
32. Janitorial services create jobs at $16,351 per position
Labor-intensive service businesses are highly efficient job creators, needing relatively little capital investment per employee.*
SBA 7(a) loan performance
How often do SBA-backed businesses actually succeed? These small business success statistics break down loan outcomes across the entire portfolio.
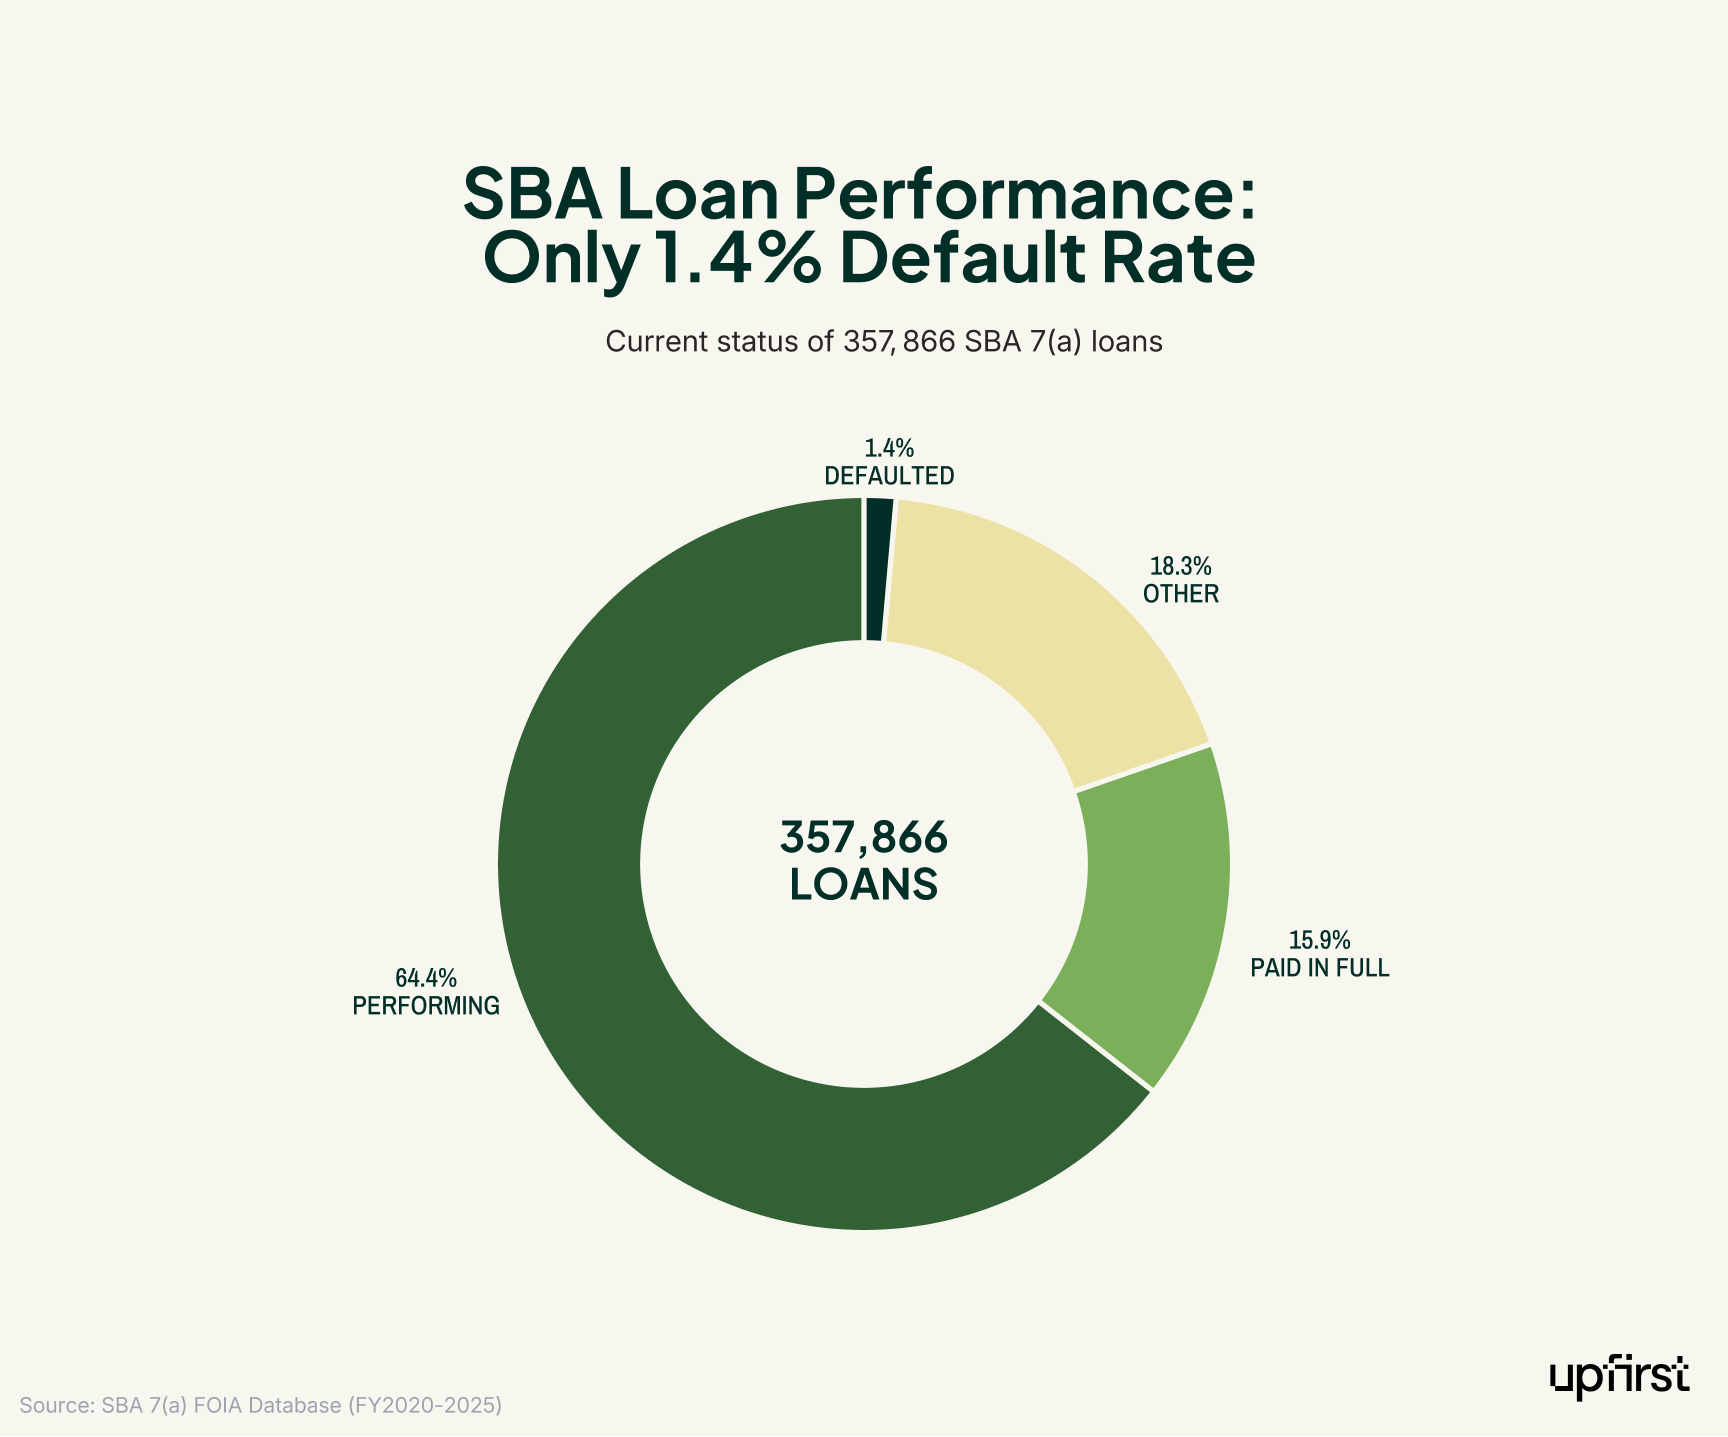
33. 64.4% of SBA loans are currently performing (EXEMPT status)
These 230,458 loans are in good standing with no issues reported.*
34. 15.9% of loans have been paid in full
These 56,816 loans were successfully repaid, representing the program's completed success stories.*
35. Only 1.4% of loans have been charged off (defaulted)
The 4,865 defaulted loans resulted in $667 million in losses — a relatively low default rate for small business lending.*
36. 70.7% of SBA loans have 5-10 year terms
This is the most common loan structure, giving businesses a manageable repayment window.*
SBA 7(a) top lenders
37. Huntington National Bank leads all SBA lenders with 36,214 loans
Based in Ohio, Huntington issued $8 billion in SBA loans — more than any other financial institution.*
38. Live Oak Banking Company has the highest average loan size among top lenders at $1.39 million
The North Carolina-based bank focuses on larger transactions, with an average loan nearly 3x the national average.*
39. The top 10 SBA lenders issued 42% of all loans
SBA lending is concentrated among major financial institutions — less than a dozen banks handle nearly half of all 7(a) loans.*
Business formation statistics
Census data reveals some surprising small business growth statistics — from record-breaking application numbers to sharp regional divides.
40. 5.24 million business applications were filed in 2024
Based on Census Bureau Business Formation Statistics, 5.24 million new business applications were filed nationwide.*
41. 2025 is on pace to set a new record with 5.68 million applications through early data
This represents 8.5% growth over 2024, suggesting entrepreneurial momentum continues to accelerate.*
42. Florida leads the nation in business formation with 634,610 applications (12.1% of national total)
California (517,360) and Texas (491,210) follow, but Florida has pulled ahead as the top state for new business activity.*

43. The second week of January has the highest business formation rate
An average of 120,484 applications are filed in Week 2, likely due to New Year's resolutions and tax planning.*
44. Late December has the lowest formation rate at 45,990 applications per week
Holiday weeks see 62% fewer business applications compared to peak periods.*
45. Montana had the fastest-growing business formation rate at +13.8% year-over-year
Washington (+13.3%) and Oregon (+6.8%) also showed strong growth, suggesting momentum in the Pacific Northwest and Mountain West.*
46. Louisiana saw the steepest decline in business formation at -14.8%
Georgia (-12.5%) and Mississippi (-11.6%) also declined — the Southeast saw a mixed picture with some states surging and others contracting.*
47. "High-propensity" business applications (likely to become employers) dropped from 37.8% in 2019 to 30.3% in 2025
More applications are sole proprietorships rather than businesses that will hire employees — meaning the headline formation numbers overstate actual employer creation.*
Federal contracting statistics
48. Small businesses received $175.7 billion in federal contracts in FY2025
Based on USASpending.gov data through the current fiscal year, small businesses won over $175 billion in government work.*

49. Small businesses won 22.6% of total federal contract dollars
Total federal contracting was $778 billion, with small businesses capturing nearly a quarter of that spending.*
50. The Department of Defense awarded $102.6 billion to small businesses
DOD accounts for 58% of all small business federal contracts — the military is by far the largest customer.*
51. Virginia received the most small business contract dollars at $31.5 billion
The proximity to federal agencies in the DC metro area drives this concentration of contract dollars.*
52. "Other Computer Related Services" is the top industry for federal small business contracts at $16.9 billion
IT services dominate government small business spending — technology is the biggest category by far.*
53. 2.9 million federal contract actions went to small businesses in FY2025
This includes individual purchase orders and contract modifications, totaling 2.9 million separate transactions.*
What these statistics mean for your business
If you're seeking SBA financing
Our small business lending statistics show that interest rates have doubled since 2021, but 2025 is showing early signs of relief. The median loan is around $190,000, so if you need that amount or less, you're in the mainstream of borrowers. Full-service restaurants and fitness centers get the most approvals, but be aware these industries also have higher default rates.
Franchise businesses get significantly larger loans on average. If you're considering a franchise, the SBA data shows lenders are comfortable with these deals. However, hotel and restaurant franchises require over $2 million on average.
If you're starting a business
The small business growth statistics paint a clear picture: Florida, California, and Texas see the most business formation, but that also means more competition. Montana and Washington are showing the fastest growth rates with potentially less saturation. If you're serious about launching, file in early January when momentum is highest and professional services are primed for new business clients.
The decline in "high-propensity" applications suggests more people are starting solo ventures rather than businesses intended to hire employees. If you do plan to hire, you may face less competition for workers than the headline numbers suggest.
If you're targeting government contracts
Small businesses are winning $175+ billion annually in federal contracts, with IT services and construction leading the way. Virginia, Maryland, and California receive the most contract dollars due to proximity to federal agencies. If you're located elsewhere, consider the GSA Schedule program or subcontracting relationships with prime contractors in the DC metro area.
For the economy overall
SBA loans are supporting nearly 4 million jobs, with the most efficient job creation in healthcare and service industries. The small business success statistics are encouraging — the low default rate (1.4%) suggests the SBA program is working well, though higher interest rates may increase defaults in coming years.
Business formation remains strong, but the shift away from high-propensity applications signals that fewer new businesses intend to become significant employers. This could have implications for job growth projections.
Methodology
SBA 7(a) analysis
We downloaded the complete FOIA release of SBA 7(a) loans from FY2020 to present (as of December 31, 2025) from data.sba.gov. The dataset contains 357,866 individual loan records with fields including loan amount, industry (NAICS code), business age, franchise status, jobs supported, loan status, interest rate, and geographic information. We performed aggregation analysis using Python to calculate totals, averages, medians, and distributions across all variables.
Business formation statistics
We downloaded weekly business application data from the Census Bureau's Business Formation Statistics program. This data tracks applications for Employer Identification Numbers (EINs), which serve as a proxy for new business formation. We analyzed seasonality patterns, state-by-state trends, and year-over-year growth rates.
Federal contract data
We queried the USASpending.gov API to retrieve contract data filtered by small business recipient status. We aggregated by fiscal year, awarding agency, industry (NAICS), and recipient state to identify patterns in federal small business contracting.
All analysis was performed in February 2025 using the most recent data available from each source.

Nick Lau is a copywriter and content lead for Upfirst.ai. A self-starter at heart, he dove into marketing in 2015 by launching an e-commerce company, selling private-labeled products on Amazon and Shopify. When he’s not crafting copy, you might spot him on a winding road trip to the coasts or through forests, in search of unexplored places.