- The U.S. call center industry employs 2.73 million people, but it's projected to shrink by 5% over the next decade as automation and self-service tools take over more customer interactions
- Consumer complaints are skyrocketing and rarely get resolved -- only about 1 in 100 complaints filed with the CFPB in 2024 resulted in any money back, even though companies claim a 99.7% "timely response" rate
- Call center turnover runs between 30-45% per year, and replacing a single agent costs $10,000-$20,000, which means the industry spends billions just keeping seats filled
How much do call center workers actually earn? Is the industry really shrinking, or just shifting? And when consumers complain, does anything happen?
To find out, we went straight to the source. We pulled employment and wage data from the Bureau of Labor Statistics, queried 8 million+ consumer complaints from the CFPB's public API, analyzed FTC telemarketing data, and dug through SEC filings from the largest publicly traded call center companies.
Whether you're running a contact center, building automation tools, or researching the future of customer service, these 37 statistics give you the real picture of the call center industry in 2026.
Where we got our data
Unlike most "call center statistics" posts that aggregate secondhand numbers, we built this article on primary data pulled directly from public federal databases and corporate filings. Here are our sources:
Federal data (queried directly)
Bureau of Labor Statistics (BLS) Occupational Employment and Wage Statistics -- May 2024 data for Customer Service Representatives (SOC 43-4051), Telephone Operators (SOC 43-2021), and the Telephone Call Centers industry (NAICS 561420). Employment, wages, and geographic data.
BLS Occupational Outlook Handbook -- 2024-2034 employment projections, annual openings, and education requirements.
BLS Current Population Survey (CPS) -- Telework rates by occupation group, updated through 2025.
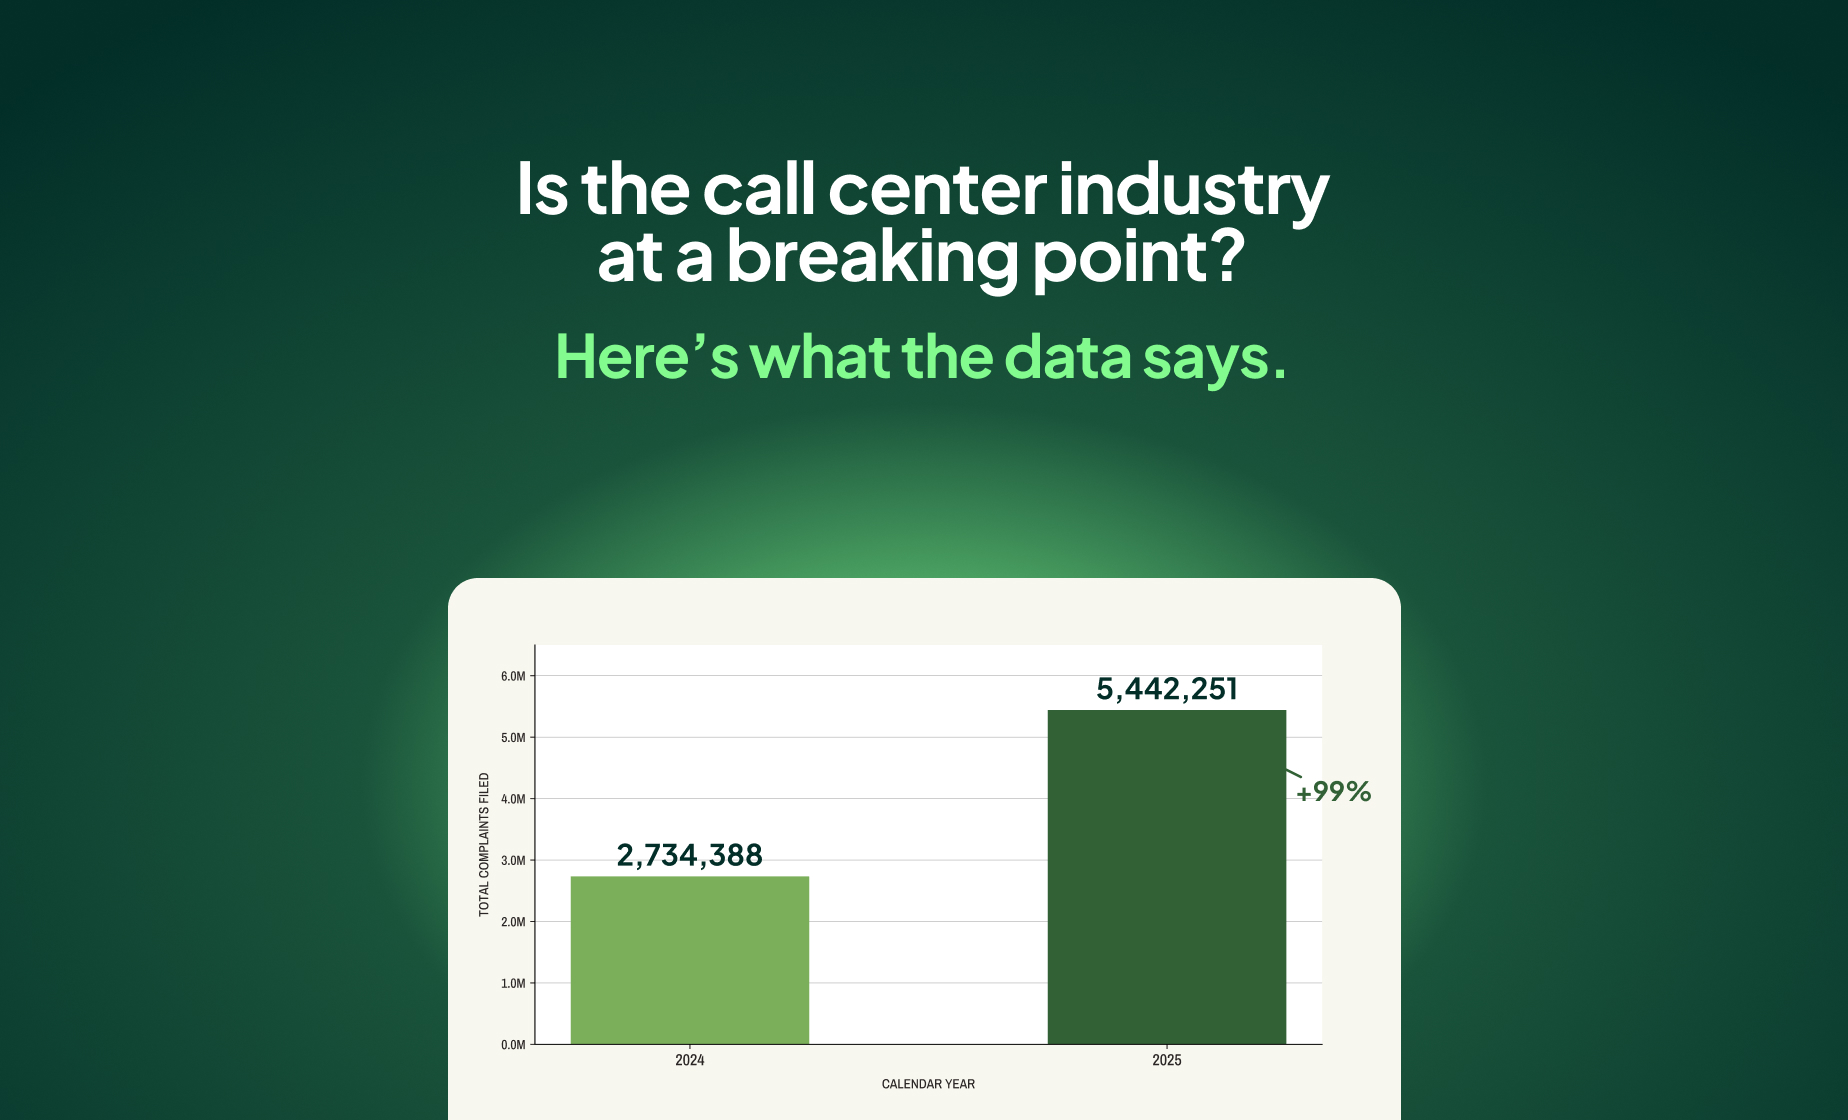
CFPB Consumer Complaint Database -- We queried the CFPB's public API to analyze 2,734,388 complaints filed in 2024 and 5,442,251 filed in 2025. We ran keyword searches across 814,434 complaint narratives to measure how often consumers report specific call center frustrations.
FTC National Do Not Call Registry Data Book -- FY2024 and FY2025 complaint volumes, robocall trends, and registry data.
U.S. Census Bureau County Business Patterns -- Establishment and employment data for NAICS 561422 (Telemarketing Bureaus and Other Contact Centers).
Corporate filings
Teleperformance 2024 Annual Results -- Revenue, headcount, and AI investment data.
Concentrix 10-K (FY2024) -- Revenue and employee data from SEC filing.
TTEC Holdings 10-K (FY2024) -- Revenue and employee data.
TaskUs FY2024 Results -- Revenue and employee data.
This data was collected in February-March 2026. All CFPB figures were queried directly from the public API with date filters applied.
Call center workforce statistics
The Bureau of Labor Statistics tracks customer service representatives as one of the largest occupations in the country. Here's what the latest data shows about the people working in call centers.
1. There are 2.73 million customer service representatives employed in the U.S.
As of May 2024, the BLS counts 2,725,930 customer service representatives across all industries. That makes it one of the 30 largest occupations in the country, employing more people than registered nurses (3.3M) but fewer than retail salespersons (4.0M).
2. Customer service rep employment is projected to decline 5% by 2034
The BLS projects that customer service representative employment will decline by approximately 5% between 2024 and 2034. The agency attributes this to self-service systems, social media support, mobile applications, and other automation technologies that are reducing the need for live agents, especially in retail trade.
3. Despite the decline, 341,700 call center positions will open every year
Even with a shrinking overall workforce, the BLS projects 341,700 annual openings for customer service representatives through 2034. Every single one of these openings comes from replacement needs, meaning workers transferring to other occupations or exiting the labor force entirely. None are from growth. This is a turnover-driven job market.
4. The median call center wage is $20.59 per hour ($42,830 per year)
The national median wage for customer service representatives sits at $20.59/hour as of May 2024. That's just below the median for all U.S. occupations. The full wage spectrum ranges from $14.75/hour at the 10th percentile to $30.16/hour at the 90th percentile, meaning the highest-paid reps earn more than double the lowest-paid ones.
5. Customer service reps in utilities earn $60,520 -- nearly double those in entertainment ($31,760)
Industry matters enormously for call center pay. A customer service rep working for a utility company earns an average of $60,520 per year, while the same role in arts, entertainment, and recreation pays an average of $31,760. That's a 90% pay gap for functionally similar work.

6. The highest-paid customer service niche: water transportation support at $94,790/year
The single highest-paying niche for customer service representatives is "Support Activities for Water Transportation," where reps earn an average of $94,790 annually. Aerospace manufacturing ($70,620), iron and steel mills ($69,030), and motor vehicle manufacturing ($67,320) round out the top-paying niches. These outlier wages are rarely cited because most statistics reports only look at industry-level averages.
7. Texas employs the most customer service reps (330,540), outpacing California by 80%
Texas leads all states with 330,540 customer service representatives, followed by Florida (238,300), California (183,350), New York (145,100), and Illinois (109,940). Texas employs nearly 80% more customer service reps than California despite having a smaller total population, reflecting the concentration of call center operations in the state due to lower costs and business-friendly regulations.

8. Washington, D.C. pays customer service reps the most ($54,520 mean annual wage)
The District of Columbia leads all U.S. states and territories in average pay for customer service representatives at $54,520 per year, followed by Washington state ($54,410), Massachusetts ($51,850), and Minnesota ($50,020). At the other end, Puerto Rico pays the least at $26,730 -- less than half of D.C.'s rate.
9. Only 3,950 telephone operators remain employed in the U.S.
The BLS counts just 3,950 telephone operators remaining in the entire country as of May 2024, a role that once employed hundreds of thousands. The occupation is projected to continue declining. Their median wage is $18.81/hour ($39,130/year), and the primary remaining employer is the healthcare industry. This near-extinction is a preview of what automation could do to broader call center roles.
10. Call center jobs require only 2-4 weeks of on-the-job training
The BLS classifies customer service representatives as requiring a high school diploma and "short-term on-the-job training," typically 2 to 4 weeks. The exception is finance and insurance call centers, which may require several months of training due to regulatory complexity. No prior work experience is required.
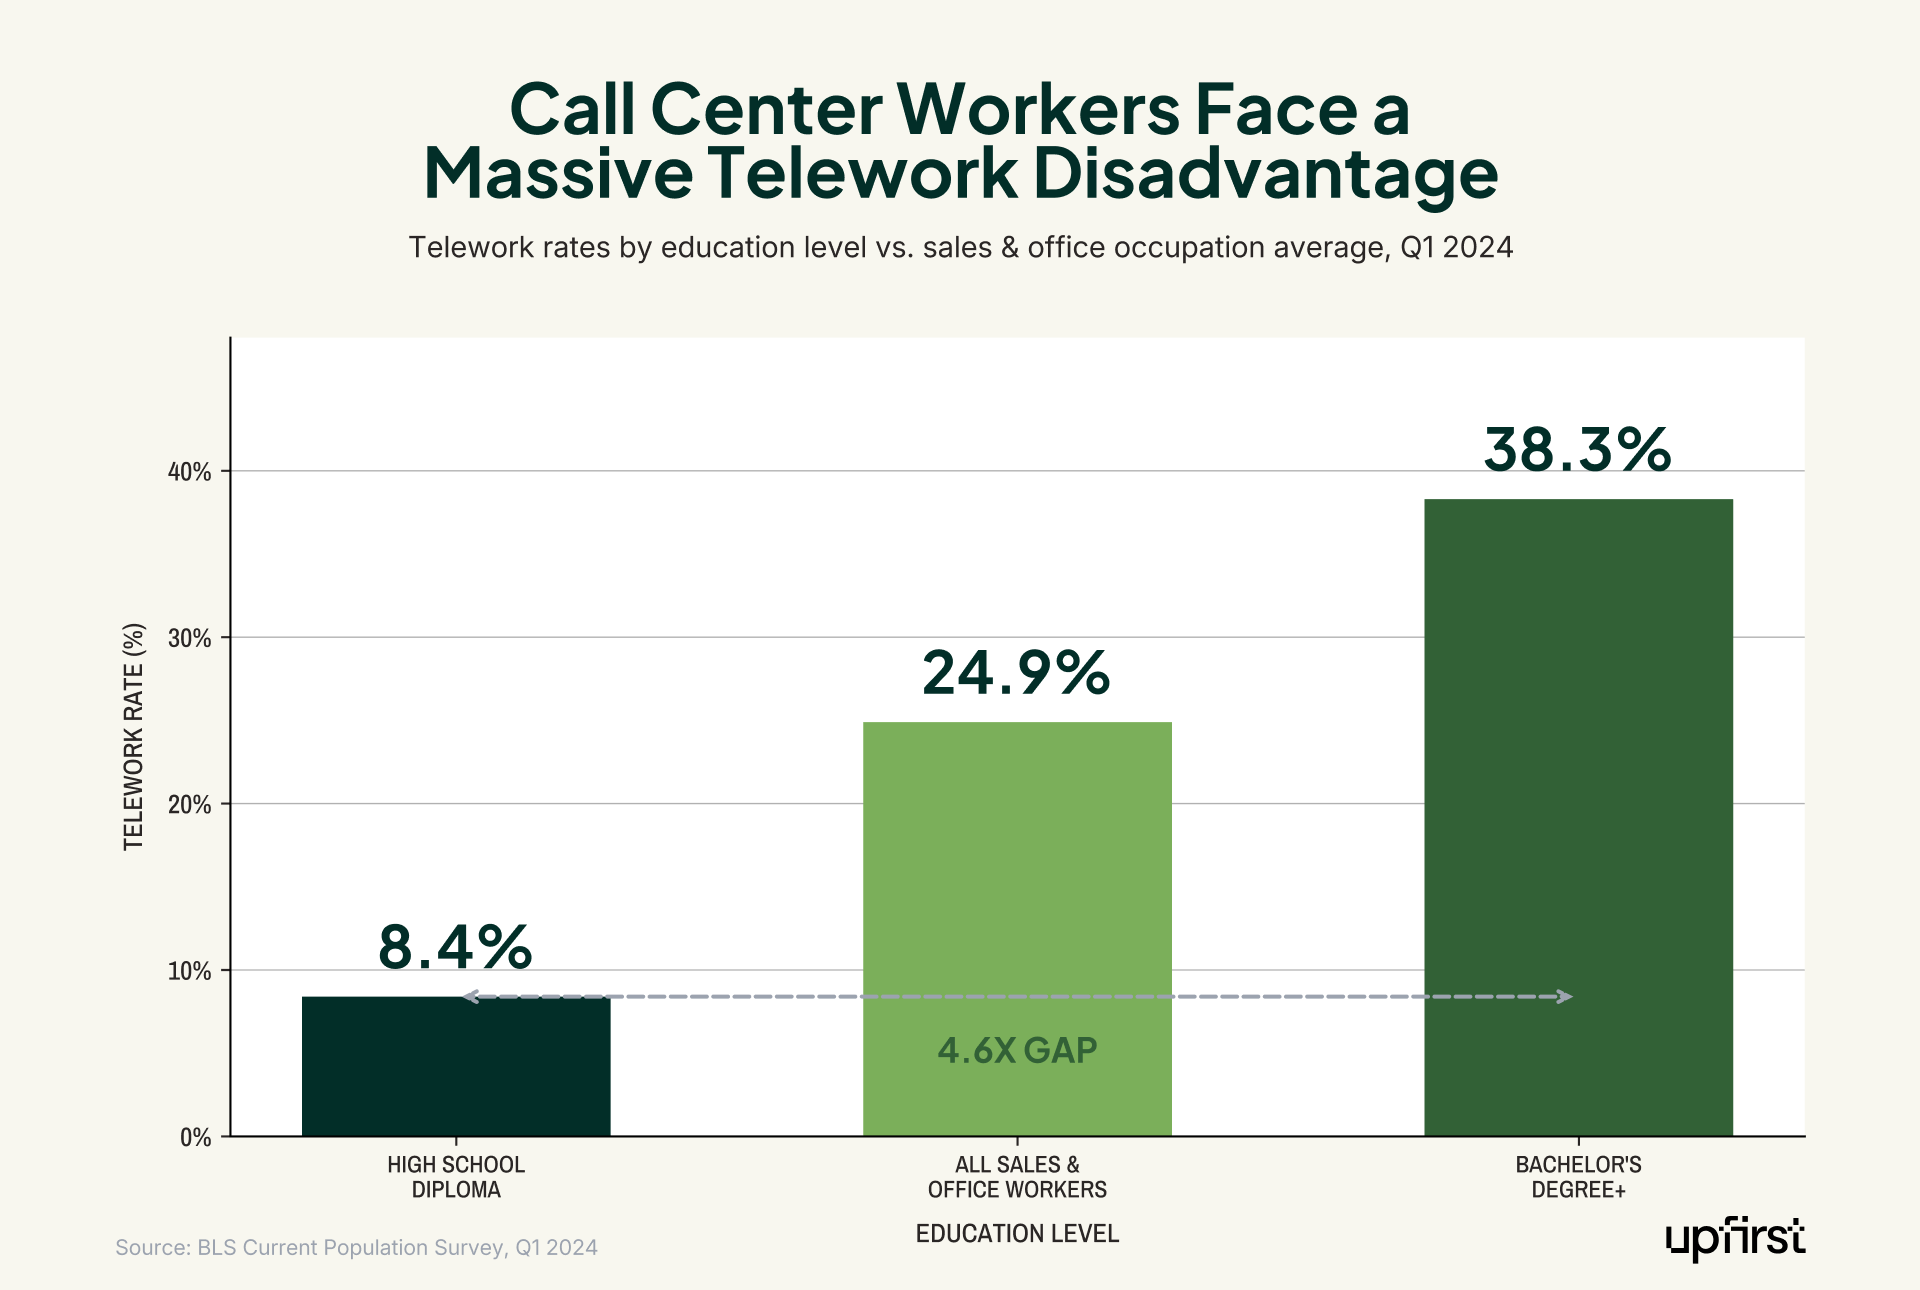
11. 24.9% of sales and office workers now telework
According to the BLS Current Population Survey, 24.9% of workers in "sales and office occupations" (which includes customer service representatives) teleworked as of Q1 2024. That's above the 22.9% national average for all occupations, reflecting the shift to remote and hybrid call center models that accelerated during the pandemic and has persisted since.
Call center industry statistics
Beyond the workforce, the call center industry itself is a massive global business. Here's what corporate filings, census data, and market research reveal about the industry's scale.
12. The global call center market is valued at $352 billion
The global call center market reached an estimated $352.4 billion in 2024 and is projected to grow to $500.1 billion by 2030, representing a 6% compound annual growth rate. The outsourced segment alone was worth $97.3 billion.
13. The U.S. has over 3,700 contact center establishments employing 410,000 people
According to the U.S. Census Bureau's County Business Patterns (2021), there are 3,727 establishments classified under NAICS 561422 (Telemarketing Bureaus and Other Contact Centers), employing approximately 410,038 people. This covers only third-party/outsourced contact centers and does not include companies running their own in-house customer service operations. More recent data (2023) shows the industry has contracted to 3,106 establishments and 344,605 employees, reflecting the impact of automation and consolidation.
14. The telephone call centers industry pays an average of $32.04/hour
Workers in the telephone call centers industry (NAICS 561420) earn an average hourly wage of $32.04 and work an average of 36.2 hours per week. This industry-level average is higher than the occupation-level average for customer service reps ($21.82) because it includes supervisors, managers, IT staff, and other higher-paid roles within call center operations.
15. Teleperformance is the world's largest call center company with 446,000 employees
Teleperformance reported 2024 full-year revenue of EUR 10.28 billion and employed 446,052 people as of December 31, 2024, making it the largest call center/BPO company in the world by headcount. The company increased its workforce by 85,072 employees (23.6%) in a single year, largely through acquisitions.
16. Concentrix generated $9.6 billion in revenue with ~450,000 employees
Concentrix reported fiscal year 2024 revenue of approximately $9.62 billion, representing 35.2% growth year-over-year (driven largely by its Webhelp acquisition). The company employs approximately 450,000 people globally.
17. The top 4 publicly traded call center companies collectively employ over 1 million people
Combining the latest filings from the four largest publicly traded call center/BPO companies:
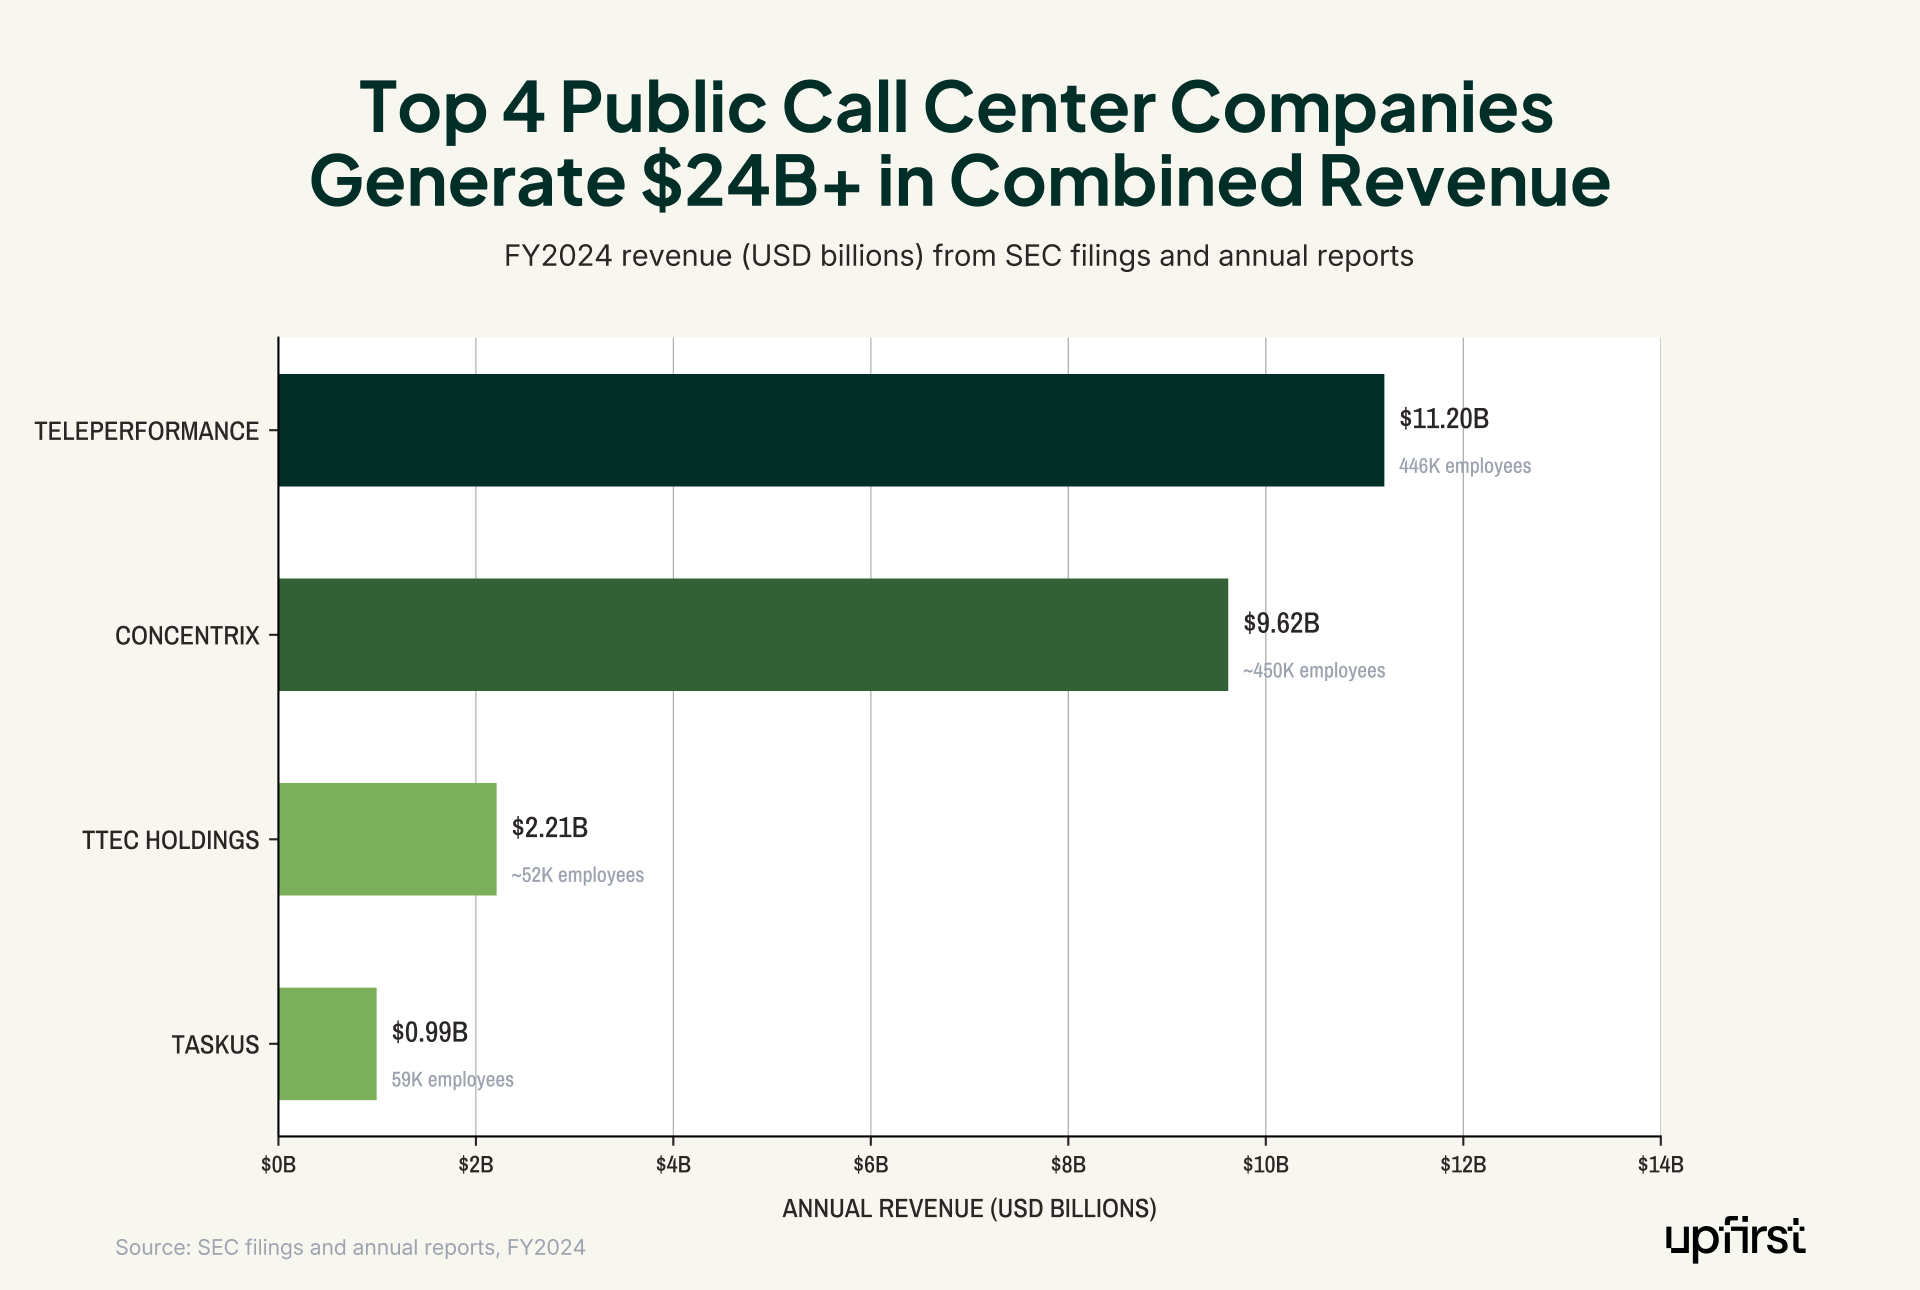
These four companies alone employ more than 1 million people and generate approximately $24 billion in annual revenue. And these are just the publicly traded players. Private companies like Foundever (~150,000 employees) and Alorica (~100,000) add significantly to the total.
18. Teleperformance is investing up to EUR 100 million in AI partnerships in 2025
Teleperformance announced an AI investment program of up to EUR 100 million for 2025, targeting partnerships with AI technology providers. This is one of the largest disclosed AI investment commitments from a pure-play call center company, signaling the industry's rapid pivot toward AI augmentation.
19. TTEC's revenue declined 10.4% year-over-year and posted a $311 million net loss
Not all call center companies are thriving. TTEC Holdings reported FY2024 revenue of $2.21 billion, down 10.4% from the prior year, and a net loss of $310.6 million (-14.1% margin). This signals that mid-size BPO providers are under significant pressure from both AI disruption and pricing competition from larger players.
Consumer complaint statistics (CFPB analysis)
We queried the CFPB Consumer Complaint Database API directly to analyze how consumers experience interactions with financial companies, including their call center and customer service experiences. This section represents our most original research.
20. Consumers filed 5.4 million complaints with the CFPB in 2025, nearly double the 2.7 million filed in 2024
The CFPB received 2,734,388 consumer complaints in 2024 and 5,442,251 in 2025 -- a 99% increase in a single year. While much of this growth is driven by credit reporting disputes, the sheer volume indicates mounting consumer frustration with financial services customer support.

21. Only 0.87% of consumer complaints in 2024 resulted in monetary relief
Of 2.73 million complaints filed in 2024, just 23,743 (0.87%) were closed with monetary relief. The vast majority were closed with either an explanation (49.0%) or non-monetary relief (50.1%). In 2025, the monetary relief rate dropped further to 0.48%. When consumers go through the effort of filing a formal complaint, fewer than 1 in 100 receive any money back.

22. Companies claim a 99.7% "timely response" rate to complaints
In 2024, companies responded to 99.71% of CFPB complaints within the required timeframe. But "timely" doesn't mean "satisfactory" -- as the 0.87% monetary relief rate shows, most "timely" responses are just form-letter explanations. The gap between response speed and resolution quality is striking.
23. Three credit bureaus account for 84% of all consumer complaints
TransUnion (790,668), Experian (754,847), and Equifax (752,722) collectively received 84.06% of all CFPB complaints in 2024. The next-closest company, Capital One, received just 0.75% of complaints. This extreme concentration means the call centers of these three companies handle the overwhelming majority of consumer financial disputes.

24. "No response" is the #1 complaint mentioned in consumer narratives (9% of all narratives)
We analyzed 814,434 consumer complaint narratives from 2024 by searching for keywords related to call center experiences. The term "no response" appeared in 73,607 narratives (9.04%), making it the most common customer service frustration. The full breakdown:

25. Complaints mentioning "transferred" grew 156% year-over-year
The number of CFPB complaints where consumers mentioned being transferred between representatives surged from 26,138 in 2024 to 66,888 in 2025, a 155.9% increase. Complaints mentioning "customer service" grew 119.6%, and those mentioning "on hold" grew 57.8%. These trends suggest that call routing and handoff problems are accelerating, not improving.

26. "Rude" appears in only 0.31% of complaint narratives -- systemic issues outweigh interpersonal ones
Only 2,514 of 814,434 complaint narratives in 2024 mentioned the word "rude." Compare that to "no response" (9.04%), "transferred" (3.21%), or "on hold" (2.01%). Consumers are far more frustrated by systemic problems like being unable to reach anyone, getting bounced between departments, and never hearing back than they are by individual rudeness. This challenges the common industry narrative that agent training is the primary lever for improving customer satisfaction.
27. 98.6% of consumer complaints are now filed online
In 2024, 2,695,159 of 2,734,388 CFPB complaints (98.57%) were submitted via the web. Only 0.74% came by phone, 0.41% by referral, and 0.29% by postal mail. By 2025, online submissions rose even further to 99.34%. The phone -- the call center's core tool -- is becoming irrelevant even for the act of complaining about call center experiences.
28. Florida and Texas generate the most consumer complaints
Florida leads all states with 391,542 CFPB complaints in 2024 (14.32% of the total), followed by Texas (359,432, 13.14%), California (268,701, 9.83%), Georgia (205,190, 7.50%), and New York (181,803, 6.65%). Notably, Florida generates more complaints than California despite having a much smaller population, suggesting higher per-capita frustration with financial services customer support.
29. 60% of companies chose not to publicly respond to complaints
When companies resolve CFPB complaints, they can choose to issue a public response. In 2024, 59.95% of companies declined to provide any public response. Only 1.14% stated they "acted appropriately as authorized by contract or law," and a mere 0.07% disputed the facts presented in the complaint. The overwhelming silence suggests that most companies prefer to handle complaints quietly rather than engage publicly.
Unwanted calls & telemarketing statistics
The FTC tracks telemarketing complaints through the National Do Not Call Registry, providing a window into how Americans experience outbound call center activity.
30. 258.5 million phone numbers are registered on the Do Not Call list
As of September 30, 2025, the FTC's National Do Not Call Registry contained approximately 258.5 million active phone number registrations, up 1.9% from FY2024 and nearly 6% from FY2021. This means the majority of American phone numbers are registered to avoid telemarketing calls.
31. The FTC received 2.6 million unwanted call complaints in FY2025
Consumers filed over 2.6 million complaints about unwanted calls with the FTC in FY2025, with the top complaint categories being debt reduction (446,243 complaints), imposters (246,228), and medical/prescriptions (208,228).
32. Robocall complaints have dropped more than 50% since 2021
The FTC received approximately 1.1 million robocall complaints in FY2024, down from more than 3.4 million in FY2021 -- a decline of over 50%. The FTC attributes this to a combination of enforcement actions, STIR/SHAKEN caller ID authentication technology, and carrier-level call blocking. However, complaints ticked back up in FY2025, suggesting the trend may be reversing.
33. "Reducing debt" was the #1 unwanted call subject in FY2025 with 446,243 complaints
Debt reduction calls dominated the FTC's complaint categories in FY2025, with 446,243 reports. Imposters (246,228) and medical/prescription calls (208,228) were the next most common. In FY2024, medical and prescription calls had been the top category with 170,000+ reports, more than half of which were robocalls.

Call center turnover & retention statistics
Turnover is the call center industry's most persistent and expensive problem. Here's what the data shows.
34. Call center turnover rates run between 30-45% annually
Multiple industry sources put annual call center agent turnover at 30-45%, with Metrigy's 2024 research pinpointing the rate at 31.2%. This means roughly one in three agents leaves their position every year, a rate that is 2 to 3 times higher than most other occupations according to the Bureau of Labor Statistics.
35. Replacing a single call center agent costs $10,000-$20,000
McKinsey & Company estimates the true cost of replacing a departing call center agent at $10,000 to $20,000 when factoring in recruiting, hiring, training, and lost productivity during ramp-up. At a 35% turnover rate across 2.7 million CSR positions, that translates to roughly $9.5 billion to $19 billion in annual turnover costs for the U.S. call center industry alone.
36. 341,700 annual openings are entirely driven by replacement, not growth
This statistic bears repeating in the turnover context: the BLS projects 341,700 annual openings for customer service representatives through 2034, and zero of those openings come from industry growth. Every single opening is a replacement for someone who left. The call center industry is a revolving door that must rehire, retrain, and ramp up hundreds of thousands of workers each year.
37. Workers with only a high school diploma telework at just 8.4%, compared to 38.3% for those with a bachelor's degree
Since customer service representative positions typically require only a high school diploma, agents face a structural disadvantage in accessing remote work. BLS data shows workers with only a high school education telework at 8.4%, while those with a bachelor's degree or higher telework at 38.3%. This gap helps explain why call center workers may have fewer flexible work options than the 24.9% telework rate for all sales and office workers would suggest.
Methodology notes
All statistics in this article are sourced from publicly available federal databases, corporate SEC filings, or published market research reports. Specific notes:
BLS data is from the May 2024 Occupational Employment and Wage Statistics release, the most recent available at time of publication. Employment projections cover 2024-2034.
CFPB data was queried from the public API at consumerfinance.gov in March 2026 using date range filters for calendar years 2024 and 2025. Narrative keyword searches count complaints where the consumer's written narrative contains the specified term. Out of 2,734,388 complaints in 2024, 814,434 (29.78%) included a consumer narrative.
FTC data is from the FY2024 and FY2025 Do Not Call Registry Data Books, published by the Federal Trade Commission.
Corporate financial data is from the most recent annual reports and SEC filings for each company, as cited individually.
Market size figures are from published market research reports and should be considered estimates with varying methodologies.
All monetary values are in USD unless otherwise noted. CFPB and BLS data is publicly available for independent verification through the links provided above.

Nick Lau is a copywriter and content lead for Upfirst.ai. A self-starter at heart, he dove into marketing in 2015 by launching an e-commerce company, selling private-labeled products on Amazon and Shopify. When he’s not crafting copy, you might spot him on a winding road trip to the coasts or through forests, in search of unexplored places.


